Three windows are important to visualizing the execution behavior of semaphores. They are the main window, History Graph window and Semaphore window. We have discussed the main window and History Graph window on a previous page, and will only present here those activities that are directly related to mutex locks.
Click on the Semaphore button in the upper-right corner to show all existing semaphores in the system as shown below. Note that only semaphores created so far will be shown in the display area, and newly created mutex locks will be shown on-the-fly.
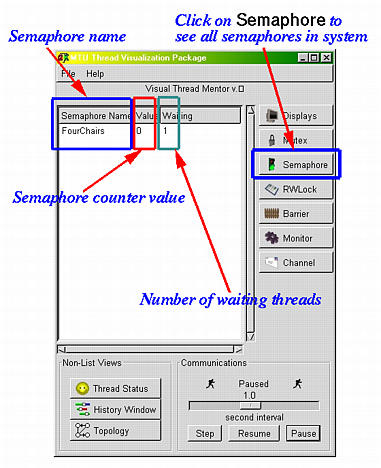
The display area is divided into three columns. The first column has the names of all created semaphores, the second shows the current value of the counter of each semaphore, and the third displays the number of waiting threads on each semaphore. In the screen-shot above, we have one semaphore FourChairs. This semaphore has one waiting thread and current counter value 0.
The activities of a semaphore are shown with three tags SW, SS and SE. See the screen-shot below. Tag SW indicates that the thread executed a semaphore wait, tag SS indicates that the thread executed a semaphore signal, and tag SE indicates that the thread is released due to a semaphore signal. Note that these tags do not tell which semaphore is involved in these three activities. To see the involved semaphore, click on a tag to bring up the source window. The line that contains the corresponding Wait() or Signal() call is highlighted.
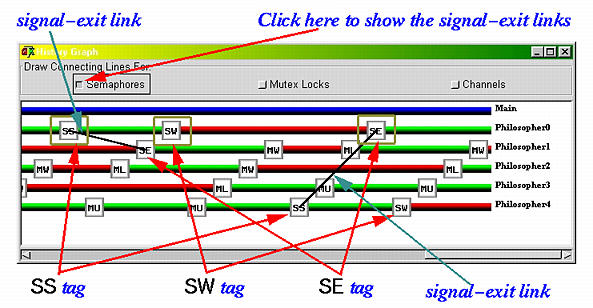
When a thread executes a semaphore wait, a SW will be shown on that thread's history bar. If this thread cannot pass through this semaphore wait, its history bar turns red, indicating that this thread is waiting. When a thread executes a semaphore signal, a SS will be shown. This signal may cause a waiting thread to be released, and, as a result, a SE tag is shown on the history bar of this released thread. If you click on the Semaphores button in the History Graph window, a line segment connecting this pair of SS tag and SE tag is show. These links are referred to as signal-exit links. Hence, between tag SW and tag SE, the history bar of a thread is shown in red. Because a thread must be in the running state to execute a semaphore signal, before and after a SS tag, the history bar must be in green, meaning that the thread is running. Of course, after a SE, the history bar is in green, meaning that the thread is running.
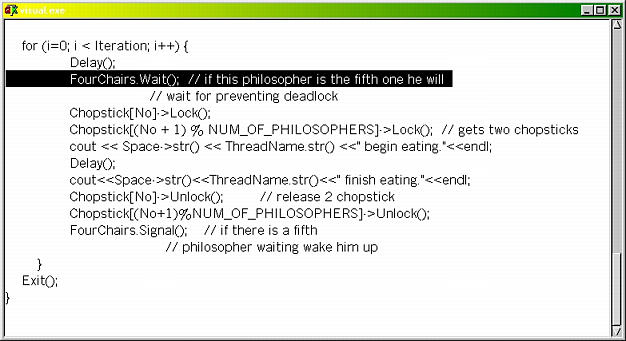
As we mentioned a number of times, clicking on a tag brings up a source window with the line that causes that event to occur highlighted. Clicking on tags SW and SS brings up a source window with the line that contains the corresponding Wait() and Signal() calls highlighted, respectively. How about clicking on tag SE? It will highlight the the Wait() call that causes the wait. This makes sense because that Wait() call causes the wait. For example, clicking on a SE tag displays the following source window. In this window, the line that contains a semaphore wait call is highlighted.
With this capability, you will be able to see clearly the wait and signal relationships, which will make debugging easier.
The two windows discussed above provide a global view of the semaphore activities. To see the micro part of each semaphore, click on the line (in the display area of the main window) that contains the semaphore you wish to examine. This will bring up a Semaphore window of that semaphore. The window below is brought up by clicking on the line that contains the semaphore name of FourChairs. You can bring up as many semaphore windows as you want.
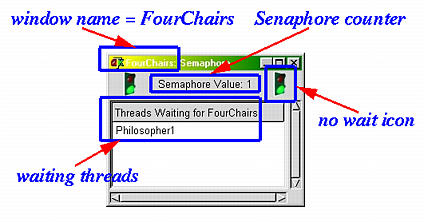
The name of this window is the name of the corresponding semaphore. Therefore, this window is named as FourChairs. In this way, you can easily identify the window you want. The top part has two traffic light icons and between them is the current value of the semaphore counter. If the semaphore has a positive counter value, the traffic light shows green as shown above in which case the next thread coming in does not have to wait. Otherwise, it is shown in red. The display area shows all waiting threads. Note that it could have more than one waiting threads. It is possible that some threads are waiting when the counter is positive. It is because there is a time gap between increasing the counter and releasing a thread. In the above figure, the semaphore counter of FourChairs is 1 and the only waiting thread is Philosopher1. Thus, the next event you will see is that thread Philosopher1 becomes running and the counter of semaphore FourChairs is zero.
